Calculation of Results
When running an ELISA, the values of the unknown samples are assigned in relation to the standard curve. If samples have been diluted, the concentration read from the standard curve must be multiplied by the dilution factor.
Always run ELISA samples in duplicate or triplicate. This will provide enough data for statistical validation of the results.
Average the duplicate or triplicate readings for each standard, control, and sample and subtract the average zero standard optical density (O.D.). The coefficient of variation (CV) of duplicates should be ≤ 20%.
Standard Curve
Create a standard curve by reducing the data using computer software capable of plotting the mean absorbance (y axis) against the protein concentration (x axis). When possible, utilize the recommended data reduction method specified in the assay protocol.
If the recommended data reduction method is unavailable, it is recommended that various methods (e.g. linear, semi-log, log/log, 4 or 5 parameter logistic) be tried to see which curve best fits the ELISA data. One way to determine if the curve fit is correct is to backfit the standard curve O.D. values. To do this, first plot the standard curve. Next, treat standards as unknowns and interpolate the O.D. values from your standard curve. They should read close to the expected values (+/- 10%). Use the data reduction method that gives the best correlation value and backfit.
If software is unavailable, the ELISA data may be linearized by plotting the log of the concentrations versus the log of the O.D. on a linear scale. The best fit line can be determined by regression analysis. This procedure will produce an adequate but less precise fit of the data.
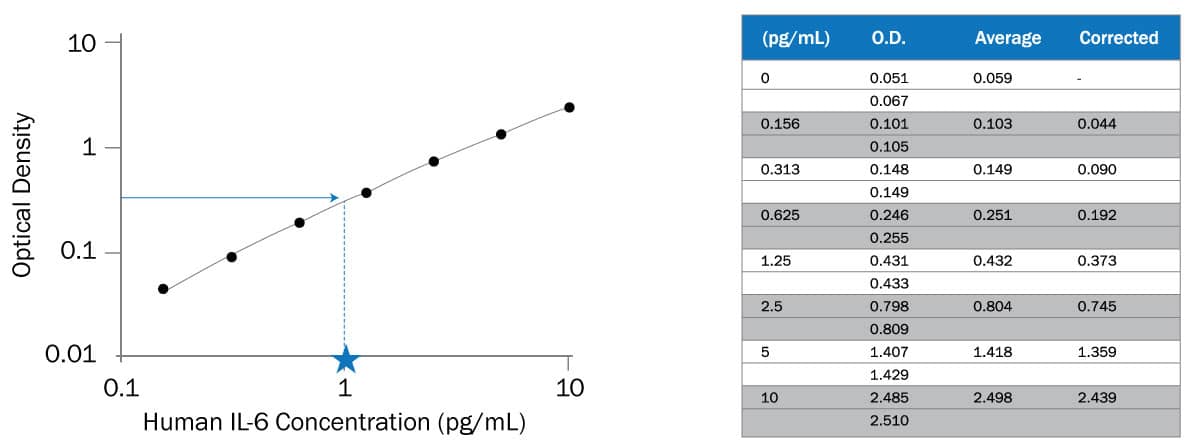
A representative standard curve is shown in the figure below from Human IL-6 HS Quantikine ELISA (Cat# HS600C).
Calculating concentration of target protein in the sample
To determine the concentration of each sample, first find the absorbance value on the y-axis and extend a horizontal line to the standard curve. At the point of intersection, extend a vertical line to the x-axis and read the corresponding concentration. If samples have been diluted, the concentration read from the standard curve must be multiplied by the dilution factor.
Calculating the coefficient of variation
The coefficient of variation (CV) is the ratio of the standard deviation to the mean, which is usually expressed as a percentage.
CV = standard deviation
mean
Calculating CV is important as it can indicate any inconsistencies or inaccuracies in your ELISA results. The coefficient of variation (CV) of duplicates should be ≤ 20%. A larger CV indicates greater inconsistency and possible error.

Search for ELISA & ELISA Kits |
ELISA Kits, Controls and Services
- ELISA Kit Formats
- View all ELISA Kits
- Coated Quantikine ELISA Kits
- DuoSet ELISA Development Kits
- Competitive Parameter ELISA Kits
- ELISA Controls
- Cytokine ELISA Kits
- Custom Assay Services
ELISA Protocols, Assay Principles and Guides
- 10 Best ELISA Practices and Techniques
- ELISA Data Analysis Guide
- Troubleshooting Guide: ELISA Development
- Help & FAQs: ELISAs
- ELISA Sample Preparation Guide
ELISA Kit 101: Introduction to the ELISA Technique
ELISA Articles and Additional Resources
Why choose R&D Systems ELISA Kits?
- Quantikine® ELISA Validation: Making the Industry Gold Standard
- R&D Systems® ELISA Kits: Quality Manufacturing and Evaluation of Performance
Blogs
- 5 Reasons Why the R&D Systems® Human Amyloid beta (aa1-40) and (aa1-42) Quantikine® ELISA Kits are the Best Kits on the Market
- Bio-Techne’s Ella Added to BioAgilytix Portfolio of Industry-Leading Immunoassay Platforms
- Quantikine ELISA Validation: Making the Industry Gold Standard
- R&D Systems® Immunoassays and Luminex® Instruments Video
Literature
- Immunoassay Solutions (pdf)
- Soluble B7-H1/PD-L1 Levels in Multiple Cancer Subtypes: High Sensitivity Measurement by Immunoassay
- Improved Sensitivity of Vitamin D BP ELISA Kits
- A New Immunoassay for Detecting Anti-Zika Virus IgG with Very Low Dengue Cross-Reactivity
- A Novel, Quantitative, Multi-analyte Immunoassay to Detect Biomarkers Involved in Lung Disease
- A Novel Quantitative Multianalyte Immunoassay to Detect Peripheral Blood Biomarkers Following Traumatic Brain Injury