 |
In vitro Ubiquitin conjugation reactions are relatively quick and simple to carry out and they can answer several questions:
- Can your protein of interest be ubiquitinated?
- If so is it mono-ubiquitinated, poly-ubiquitinated, or multi-mono-ubiquitinated?
- If it is poly-ubiquitinated what is the chain linkage?
- Which E2 enzyme and E3 ligase are required?
The protocol below describes in detail how to carry out an in vitro ubiquitination reaction and analyze the results to determine if your protein of interest is ubiquitinated. Click on the links below to view listings of Boston Biochem® proteins, enzymes, and buffers.
Materials and reagents:
| Material or Reagent | Stock Concentration |
| E1 Enzyme | 5 µM |
| E2 Enzymei | 25 µM |
| E3 Ligaseii | 10 µM |
| 10X E3 Ligase Reaction Buffer | 10X - (500 mM HEPES, pH 8.0, 500 mM NaCl, 10 mM TCEP) |
| Ubiquitin | 1.17 mM (10 mg/mL) |
| MgATP Solution | 100 mM |
| SDS-PAGE sample buffer – if not using reaction products for downstream applications | 2X |
| EDTA or DTT – if using reaction products for downstream applications | 500 mM (EDTA);1 M (DTT) |
| Microcentrifuge tubes | |
| Water Bath (37 °C) | |
| Western Blot Equipment |
iEach E2 enzyme functions with only a subset of E3 ligases and some E3’s are more promiscuous than others.
iiThe E3 ligase will likely need to be supplied by the user, but we do offer a small selection.
Procedure for a 25 µL reaction (scale as needed):
- In a microcentrifuge tube, combine the indicated volume of each component listed in the table below in the order shown. For a negative control reaction replace the MgATP Solution with dH2O.
| Reagent | Volume | Working Concentration |
| dH2O | X µL (to 25 µL; dependent on volume of substrate and E3 ligase) | N/A |
| 10X E3 Ligase Reaction Buffer | 2.5 µL | 1X - (50 mM HEPES, pH 8.0, 50 mM NaCl, 1 mM TCEP) |
| Ubiquitin | 1 µL | Approximately 100 µM |
| MgATP Solution | 2.5 µL | 10 mM |
| Substrate | X µLiii | 5-10 µM |
| E1 Enzyme | 0.5 µL | 100 nM |
| E2 Enzyme | 1 µL | 1 µM |
| E3 Ligase | X µLiv | 1 µM |
iiiThe volume needed will depend on the stock concentration of your substrate.
ivThe volume needed will depend on the stock concentration of your E3 ligase.
- Incubate in a 37 °C water bath for 30-60 minutes.
- Terminate the reaction. See the table below for the appropriate method of termination.
| Are you using reaction products for downstream enzymatic applications? | Termination method | Volume (final concentration) |
| No | SDS-PAGE sample buffer | 25 µL (1X) |
| Yes | EDTA or DTTv | 0.5 µL EDTA (20 mM) or 1 µL DTT (100 mM) |
vEDTA and DTT are equally effective at terminating the reaction; determining which to use will depend on the intended downstream enzymatic application of the reaction products.
- Analyze Ubiquitin conjugation reaction products by SDS-PAGE and Western blot.
- Determine if ubiquitination products have been generated: separate the reaction products by SDS-PAGE and stain the resulting gel with Coomassie blue. See Figure 1 below for a graphical data example and how to interpret the data.*
- Verify which bands represent ubiquitinated substrate: follow up with a Western blot using anti-Ubiquitin and/or anti-substrate antibodies. All bands on the anti-substrate blot should correlate to the anti-Ubiquitin blot, but the opposite is not true since other proteins in the reaction can often be ubiquitinated. See Figures 2 and 3 below for graphical data examples and how to interpret the data.*
- Identify E3 ligase autoubiquitination: follow up with a Western blot using anti-E3 ligase antibody. An anti-Ubiquitin Western blot alone cannot distinguish between ubiquitinated substrate and autoubiquitinated E3 ligase. See Figure 4 below for a graphical data example and how to interpret the data.*
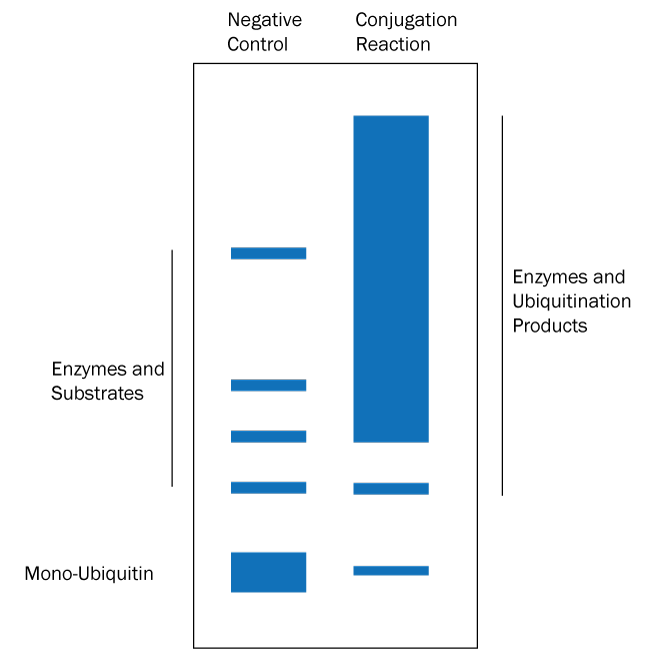 Figure 1. Graphical Representation of Ubiquitin Conjugation Reaction Products Separated by SDS-PAGE and Visualized with Coomassie Stain. Coomassie stain will bind all of the protein species in the reaction. Ubiquitination products are not able to be generated in a negative control reaction lacking MgATP solution (left lane) so all that should appear is a band for each protein used in the reaction. The conjugation reaction (right lane) yields a large number of ubiquitination products that generally appear as a smear of staining. Note also that the band representing mono-Ubiquitin at the bottom of the gel may be significantly reduced or absent in the conjugation reaction lane if the ubiquitination reaction is very efficient. If the conjugation reaction does not generate a smear or ladder of additional bands then either something was missing from the reaction or the substrate of interest is not ubiquitinated by the specific set of enzymes in the reaction. |
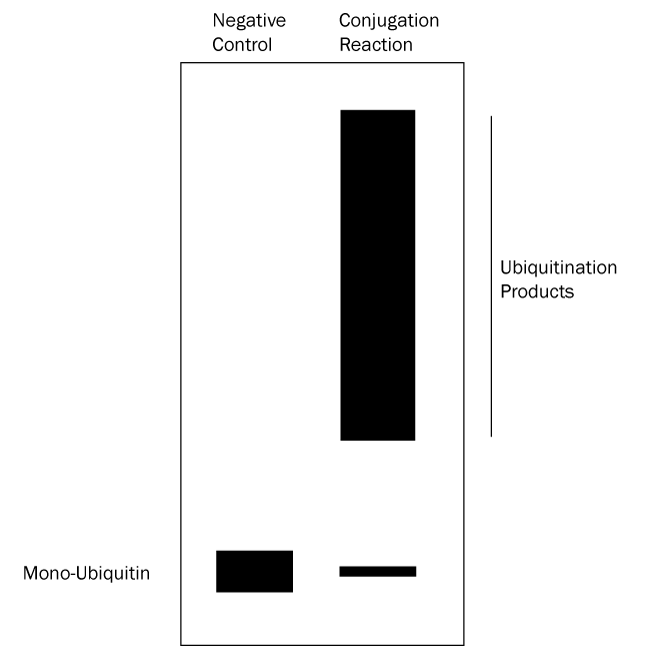 Figure 2. Graphical Representation of Ubiquitin Conjugation Reaction Products Separated by SDS-PAGE and Analyzed by Western Blot with anti-Ubiquitin Antibody. Western blot analysis with an anti-Ubiquitin antibody reveals only Ubiquitin and substrates modified with Ubiquitin. Ubiquitination products are not able to be generated in a negative control reaction lacking MgATP solution (left lane) so all that should appear is a single band representing mono-Ubiquitin. The conjugation reaction (right lane) yields a large number of ubiquitination products that generally appear as a smear or ladder of bands. Note also that the band representing mono-Ubiquitin at the bottom of the gel may be significantly reduced or absent in the conjugation reaction lane if the ubiquitination reaction is very efficient. Unlike the Coomassie stained gel, only ubiquitination products can be seen in the right lane, not any unmodified proteins. This analysis verifies that the protein species in the smear are ubiquitinated. |
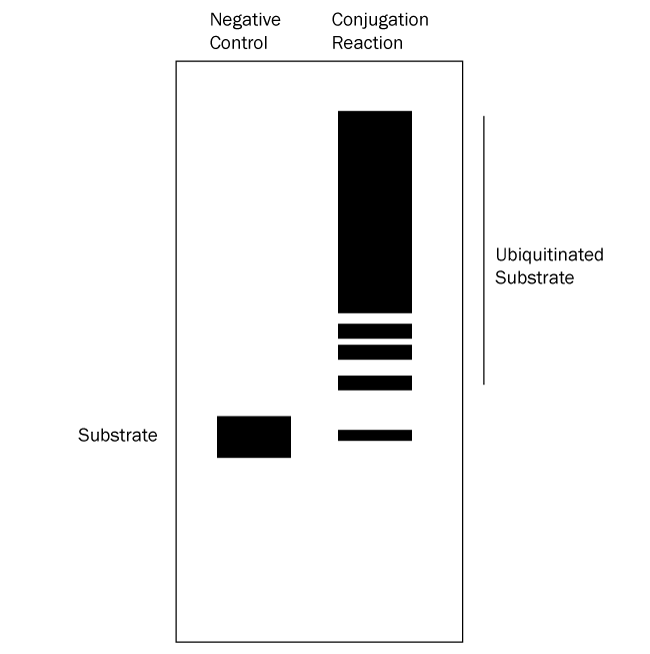 Figure 3. Graphical Representation of Ubiquitin Conjugation Reaction Products Separated by SDS-PAGE and Analyzed by Western Blot with anti-Substrate Antibody. Western blot analysis with an anti-substrate antibody reveals only the substrate and ubiquitinated substrate. Ubiquitination products are not able to be generated in a negative control reaction lacking MgATP solution (left lane) so all that should appear is a single band representing the substrate. The conjugation reaction (right lane) yields a large number of ubiquitination products that generally appear as a smear or ladder. Note also that the band representing the substrate might either mostly or completely disappear depending on how much of it becomes ubiquitinated. This analysis verifies that the substrate of interest is ubiquitinated. |
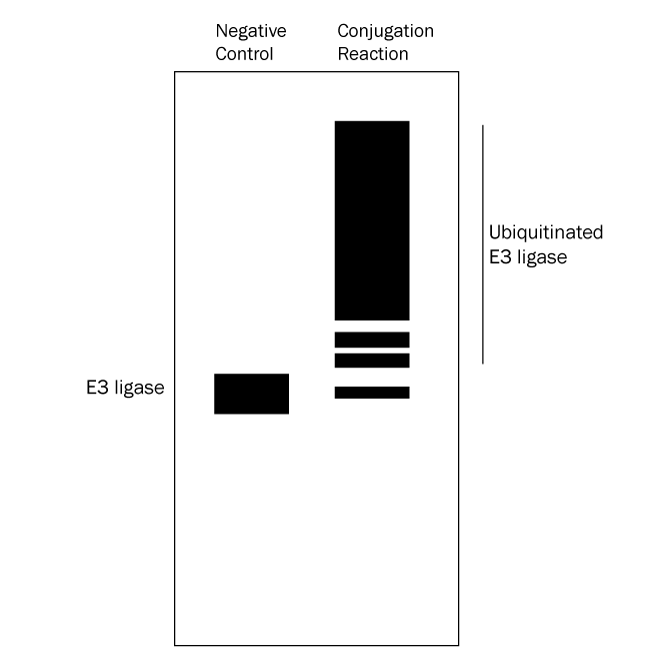 Figure 4. Graphical Representation of Ubiquitin Conjugation Reaction Products Separated by SDS-PAGE and Analyzed by Western Blot with anti-E3 Ligase Antibody. Western blot analysis with an anti-E3 ligase antibody reveals only the E3 ligaes and autoubiquitinated E3 ligase. Ubiquitination products are not able to be generated in a negative control reaction lacking MgATP solution (left lane) so all that should appear is a single band representing the E3 ligase. The conjugation reaction (right lane) yields a large number of ubiquitination products that generally appear as a smear of staining. Note also that the band representing the E3 ligase might either mostly or completely disappear depending on how much of it becomes autoubiquitinated. This analysis verifies that autoubiquitination of the E3 ligase has occurred. |
*These figures are designed to represent ideal data to serve as a teaching tool; actual data may not be as easy to analyze.